Quality control chart excel is the template for recording the quality control result from a process, mainly products processing control. Quality control is a process by which entities review the quality of all factors involved in production or service. The example of QC including inspection and examining.
This is control charts in excel 2013 version, but you can used it in another version.
TEMPLATE MENUS
Quality control chart excel only have one sheet. However in that one sheet, there are several elements or headings:
Quality Control Chart Excel Overview
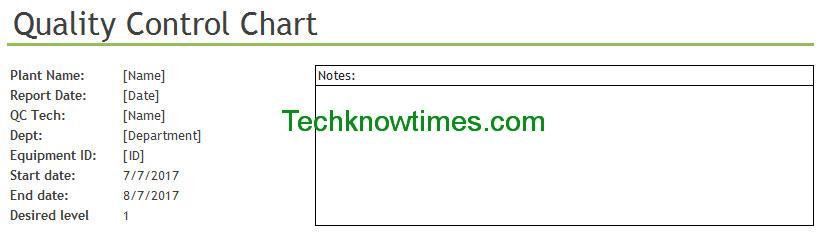
For recording the QC process overview, including data for the QC. The fields are:
- Plant Name: the name of the plant or production category used for production process.
- Report Date: the date of the QC done and reporting
- QC Tech: the employees or responsible person for QC process
- Dept: the department or division where the plant and equipment belongs or responsible to.
- Equipment ID: the number of the equipment or machine used for production.
- Start Date – End Date
- Desired Level: the result level of the QC. It determine which level the imperfection, defects, or bugs are still allowed.
- Notes: the comments from the employees or QC Tech regarding this control.

Average Daily Imperfections with Control Limits
The chart for displaying the imperfections, bugs, or defects number and mean in daily productions. The data from this chart are taken from Quality Control Chart Excel Data Entry.

Quality Control Chart Excel Data Entry
The tables where you enter the data for QC controls. The QC data that need to be entered is the imperfections number. On the table, there are provided the process control chart example data. There are 3 columns:
- Date: for process that controlled
- Number of Imperfections: the sample data taken for QC purpose, along with the bugs, defect or any imperfections number or level.
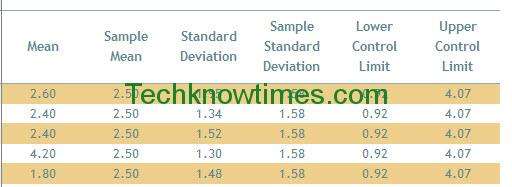
- Chart Data: the columns for providing the calculation of:
- Mean: average of the numbers: a calculated “central” value of a set of numbers. This Mean is for all Sample in one row (date).
- Sample Mean: this is the average of Total Mean from above column. Because this is average from all Mean, the values on all rows in this column are same.
- Standard Deviation: is a measure that is used to quantify the amount of variation or dispersion of a set of the imperfection values on all sample in one row (date).
- Sample Standard Deviation: the average of Total Standard Deviation in above column. Like Sample Mean, the values on all rows in this column are same.
- Lower Control Limit: Bottom limit in quality control for data points below the control (average) line in a control chart. This data points the minimum number which indicate the process remains in-control.
- Upper Control Limit: Uper limit in quality control for data points above the control (average) line in a control chart. This data points the maximum number which indicate the process remains in-control.

HOW TO USE
First enter the Overview element fields. It is important to enter the desired level, as it will be used for calculation in Data Entry.

Next, skip into Data Entry. Enter the Date. The Date fields are not automatically generated based on Start Date and End Date in Overview. So, you must enter in manually.
Next, replace the sample name and enter the imperfection found in each sample. The example included in this template is product quality control chart. The data entry calculator will automatically calculate the data and chart.
You can add another sample by inserting a column between the samples column.
The quality control chart excel template is served in daily. You can change the interval period into weekly or monthly.
CONCLUSION
The control charts in excel 2016 can be used for other process, such as software QC process in project house. The quality control chart excel can be downloaded for free after you click one of these buttons: