The stock portfolio analysis excel is the spreadsheet template to help you in analyzing the stock market. It can be used for calculating the possible result of purchased or targeted stocks. You can use it for comparing the stocks, and analyze which stock to buy or would be more profitable. The stock portfolio analysis excel is perfect for personal individual use or companies in investation industry.
Before you using the stock analysis excel template, it is suggested to research the information about the stock that you will going to analyze. The information including the company growth, market stake and interest, stock trading information, as well the accountancy journal of the company. This is because the Stock Portfolio Analysis Excel only provide the calculation methods and template. The trends information need to be provided manually.

THE MENUS
There are two sheets on stock spreadsheet template:
Portfolio Analysis
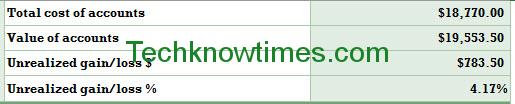
Menu for displaying the portfolio stock information along with the calculation. The Portfolio Analysis sheet has 2 elements:
- The summarized table on top right. It simply display the overview of the stock after the analysis.
- Calculation table. Enter the information here and the formula will calculate the result.
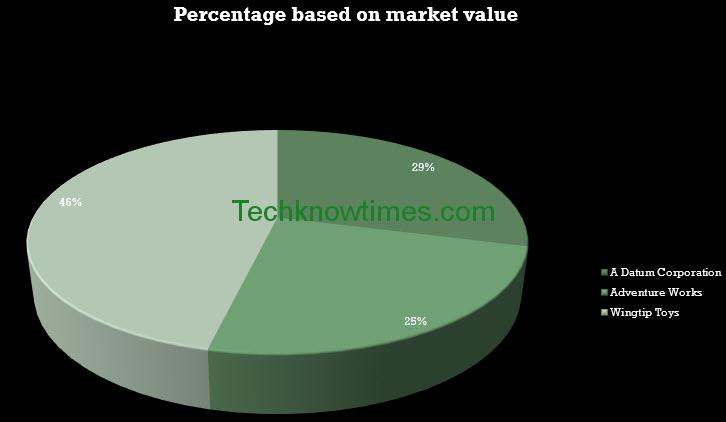
Portfolio Chart
Menu for displaying the calculation result in pie chart. The chart based on Investment name.
HOW TO USE
1. Open the stock analysis excel template, navigate to the Portofolio Analysis sheet
2. Replace the placeholder date with actual date. You can add company logo, information or contact details on the header.
3. On the calculation table, enter the company name in Investment Name column. The Account Name and Symbol columns supposed for the bank which companies shelter on.
If you want to add new investment, insert a row before Total row.
4. Enter the quantity of purchased stocks and their purchase per share columns.
5. Enter the trade fees. Trade fees is the broker charge for the purchased stocks.
It will calculate the Total Cost or purchase from Purchase Price and Fees.
6. Enter the Current Quote. Current Quote is the last price at which a security or commodity traded.

The investment spreadsheet excel formula will calculate the Market Value. Market Value come from multiplication between Quantity and Current Quote columns. The Market Value is the values for selling.
7. The Gain/Loss will display the gained or lost amount from stock trade. The amount come from subtraction betweed Market Value and Total Cost. The Loss display in red and brackets.
The Gain/Loss percentage is the increase or decrease from the Total Cost to Market Value.
8. Look at summarize table to see the overview value.
9. Go to Portfolio Chart to see the pie graphic chart.
MODIFY
Personal investment tracker excel is not too complex and easy to modify. However, you may need to learn or know about accountancy. Or, you know about financial management regarding bonds and securities. The knowledge is important for modifying purpose.
You can change the graphic chart type by navigate to Design tab > Change Chart Type.
In case if you analyze lots of stocks, you may be careful in duplicate records. To delete the duplicate records, go to Design tab or Data tab. Then click Remove Duplicates. After the Remove Duplicate dialog box appear, check only the primary key column, such as Investment Name. The newer, duplicated records will be deleted. Other way is to using filter options, and sort the record and find the duplicate data manually.
To change the Stock Portfolio Analysis Excel color schemes, go to Page Layout > Color or Themes.
CONCLUSION
Portfolio management excel download is free, to use and simple. However, you need to know about stock knowledge to use it. The Stock Portfolio Analysis Excel template is set for A4 Landscape for print.
The template is helpful if you want to learn how to do stock investment or first time in the business.
Click one of these buttons to download Stock Portfolio Analysis Excel: